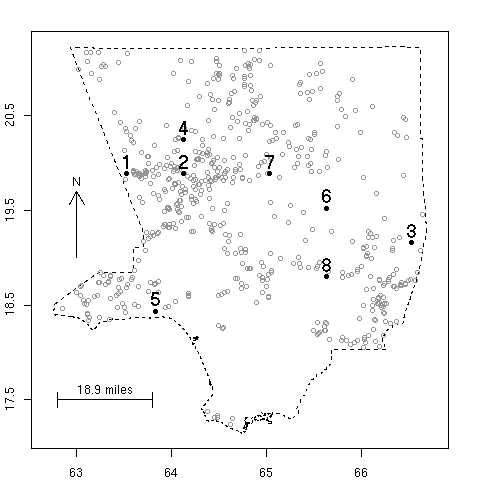
Unfortunately, the BI has two major drawbacks. First, it is only computed at eight weather stations in Los Angeles County, and must somehow be imputed (i.e. averaged, or smoothed) over all other locations in the County in order to obtain a proper summary of wildfire hazard. The plot above shows the locations of the eight "RAWS" weather stations together with the centroids of fires of at least 10 acres burning in LA County between 1976 and 2002. Currently, Los Angeles County officials do not seem to have any formal or objective procedure to do such imputation. Second, while the BI takes into account various meteorological variables, it completely ignores information on the spatial pattern of past burns, which can be very useful in determining the time since the last fire, and more importantly, how in general the background burning rate varies over space. This latter effect is crucial because even in a relatively small region (by wildfire study standards) such as Los Angeles County, the area is highly inhomogeneous in terms of background fire rate. Some areas have fires quite regularly, while some have wildfires very infrequently, and estimates of wildfire hazard can be greatly enhanced by making use of this information on past burns.
One of the main goals of this research was to investigate how optimally to use the BI, as well as the history of past burns, to infer wildfire hazard maps for Los Angeles County.
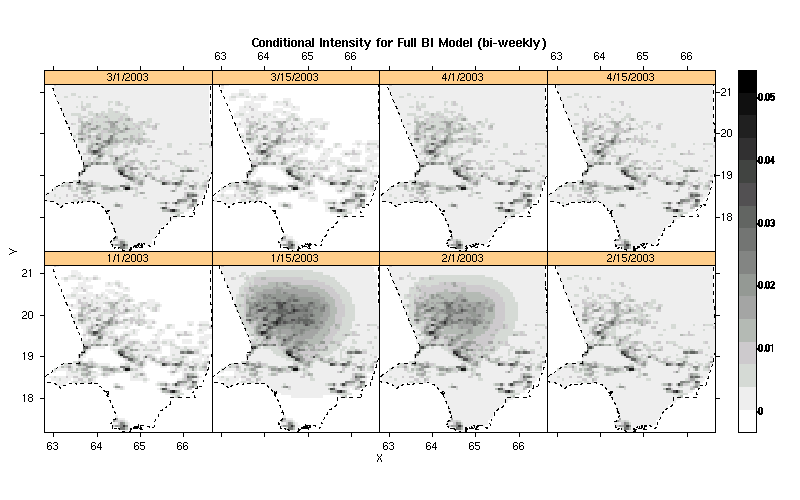
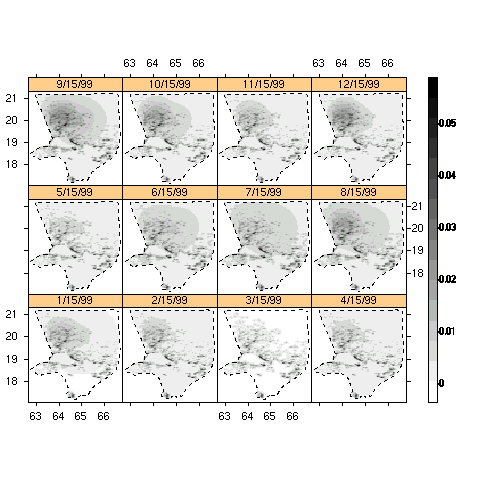
Here are some of the results. Our predicted hazard maps for 2003 are shown below, for 2-week intervals.
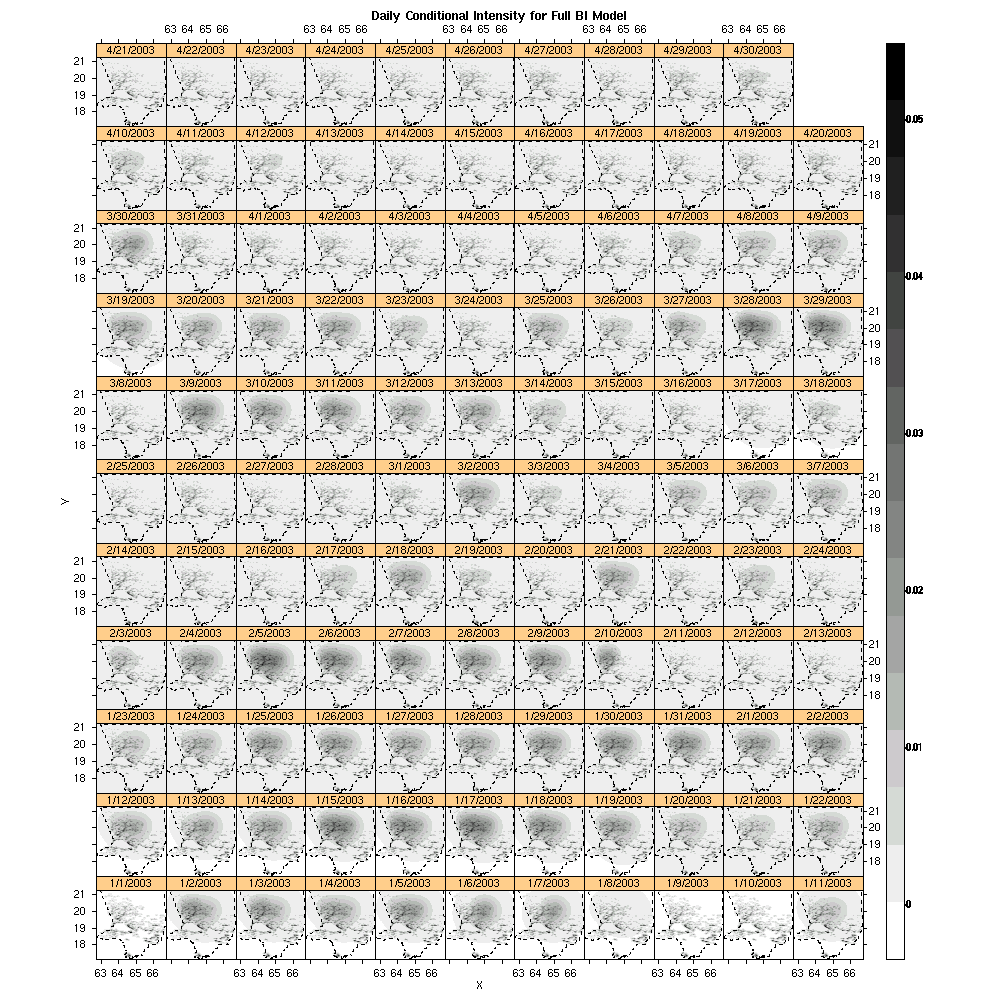
Daily values of the conditional intensity for Jan - April 2003 are shown below.
How are these estimates made? We give a brief summary here; for details, see the paper
Peng, R. D., Schoenberg, F. P., Woods, J. (2003). Multi-dimensional point process models for evaluating a wildfire hazard index. which is currently in review at JASA.
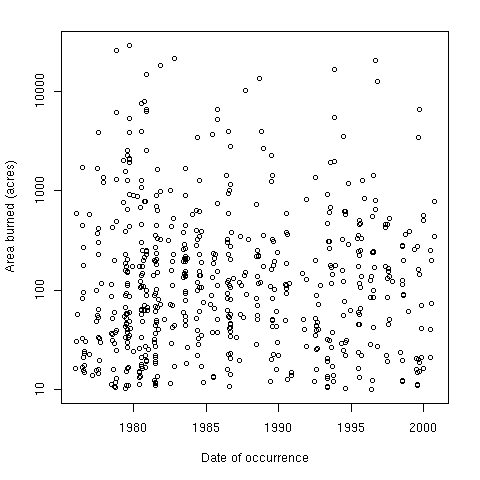
In addition to BI, information on past fires for Los Angeles County is incorporated by our model in determining wildfire hazard. The plot below shows the times and areas burned for all fires of at least 10 acres burning in LA County since 1976.
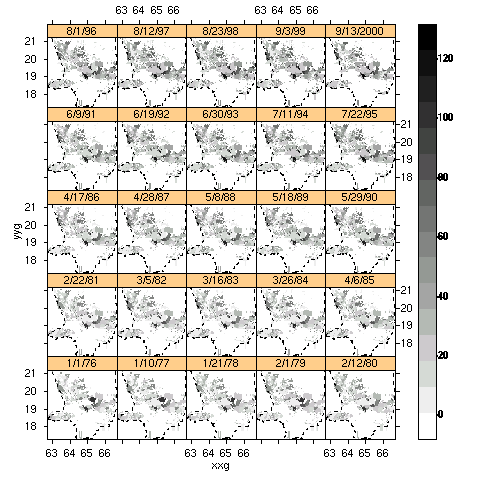
Spatial maps of these fires are investigated to see how the spatial maps of fuel age (or time-since-fire) vary over time -- results are shown in the figures below.
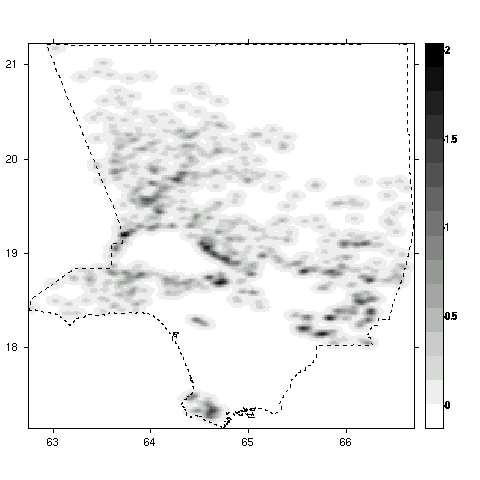
More importantly, an estimated spatial background rate is obtained by smoothing the spatial pattern of previous fires, i.e. fires occurring before 1976 (the start time for the RAWS weather stations). The smoothing is done using kernels whose bandwidths are selected by maximum likelihood when fitted to the 1976-2002 wildfire data. The resulting background wildfire rate is shown below.
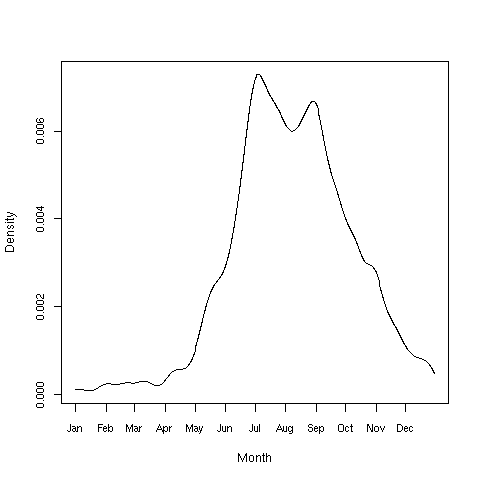
Similarly, a seasonal background rate was computed in similar fashion, using information on the temporal distribution of previous fires. This seasonal component is shown below.
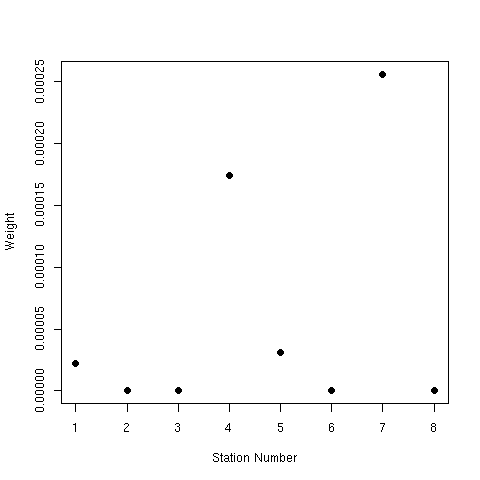
Next, in order to find the model that makes optimal use of the BI information at the 8 RAWS weather stations in imputing wildfire hazard everywhere in Los Angeles County, we fitted a point process model for wildfire occurrences, incorporating the BI as well as the spatial and seasonal background rates shown above. The plot below indicates the relative weights given by the best-fitting model to each of the 8 RAWS stations in LA County.
To our surprise, in examining the fit of the model we found that the BI model actually had much less predictive value than either the spatial or seasonal background information. Hence it is somewhat disturbing that the latter two are not formally incorporated by most practitioners into wildfire hazard models currently. See the paper Multi-dimensional point process models for evaluating a wildfire hazard index. for details.
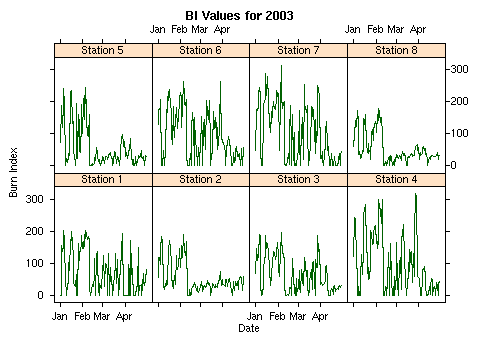
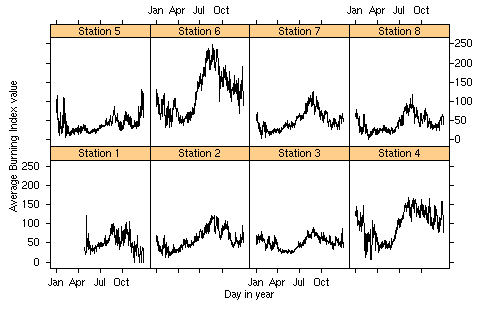
It is imperative to note that our bi-weekly and daily wildfire hazard forecasts for Los Angeles County for 2003, shown above, are merely summaries of BI, seasonal, and previous wildfire information -- they are not meant to serve directly as guides for urban planning, or governmental or societal response. As noted in the paper cited above, there may be numerous confounding factors, including most notably human factors involving ignition and suppression, which have not been incorporated in the hazard estimates. Further, note that our estimates are based heavily on BI information for those days and weeks, and thus may be artificially high for some colder months when the BI seems to produce strangely large values that do not correlate well with fire occurrence. Again, see the paper cited above for details. In particular, it appears from preliminary investigation that the BI weighs wind speed a bit too heavily, thus producing artificially high values in relatively cold and windy winter months. See for example the following two figures, which show the BI values for each of the 8 stations we used for the year 2003 (missing values imputed by averaging over previous years), followed by a plot of the seasonal fluctuations in BI, averaged across years for each station. One sees in both plots that BI is moderately high in January, though wildfires in January are very rare.
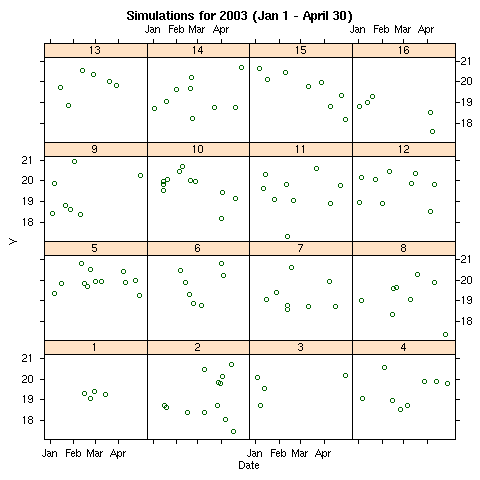
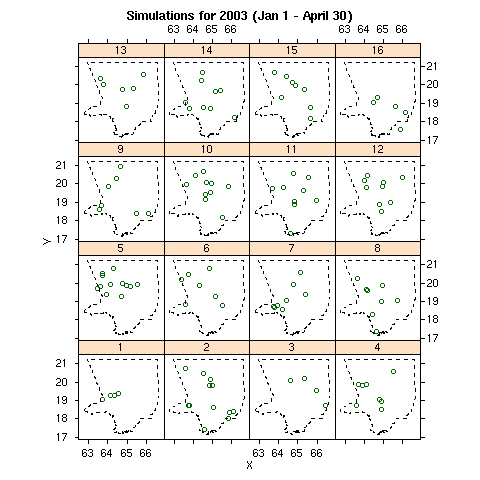
We have run several simulations of wildfire occurrences in 2003, based on our best-fitting point process model, to see what some possible outcomes might look like. The plots below show 16 simulations for 2003, using 2003 BI info obtained from Larry Bradshaw. (Time and Y coordinates) are shown in the figure below, followed by a plot of the X and Y coordinates for the same 16 simulations.
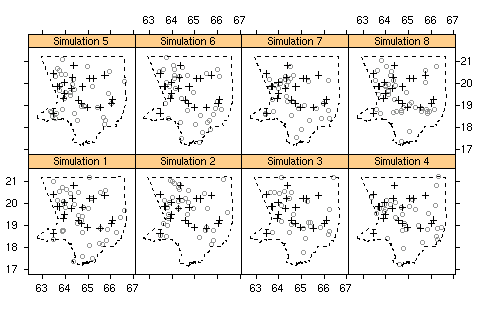
For comparison, our estimated monthly conditional intensity across LA County for the year 1999 is shown below, followed by a plot of 8 simulations of this conditional intensity for 1999. The circles represent the simulated wildfires in 1999, while the crosses represent the wildfires that were actually observed in 1999.
For suggestions, comments or questions, please contact Rick Paik Schoenberg at frederic@stat.ucla.edu.