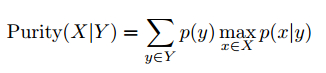
To evaluate the clustering quality, we introduce two metrics: conditional purity and conditional entropy. Given the underlying groundtruth category labels X (which is unknown to the algorithm) and the obtained cluster labels Y , the conditional purity is defined as the mean of the maximum category probabilities for (X, Y ),
and the conditional entropy is defined as,
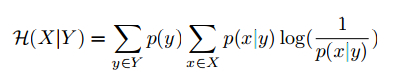
where both p(y) and p(x|y) are estimated on the training set, and we would expect higher purity and lower entropy for a better clustering algorithm.
We compare clustering by sparse FRAME with k-mean with HOG features. The methods are evaluated in terms of conditional purity and conditional entropy. All the results are obtained based on 10 repetitions. Table 1 show a description of the dataset we used. And Table 2 and 3 show the results of two methods. It can be seen that our method performs significantly better than k-mean with HOG feature, especially on the datasets in which different categories are distinguished by texture.
Method 1: EM with sparse FRAME
General Parameters: nOrient = 16; sizeTemplatex=100; sizeTemplatey=110; GaborScaleList=[1.4, 1, 0.7]; useDoG = false; isLocalNormalize = false; sigsq=10; #sketch=300; locationShiftLimit=5; orientShiftLimit=1;
HMC Parameters: lambdaLearningRate = 0.1/sqrt(sigsq); epsilon = 0.03; L = 10; nIteraton =20; 12x12 chains
Clustering Parameters: #EM iteration = 10; isSoftClassification = false.
Method 2: k-mean with HOG
General Parameters: sizeTemplatex=100; sizeTemplatey=110;
HOG Parameters: #HOG windows per bounding box =6x6; #histogram bins=9;
Name |
# Clusters |
Examples |
# Images |
|
Exp1 |
dalmatian & weimaraner |
2 |
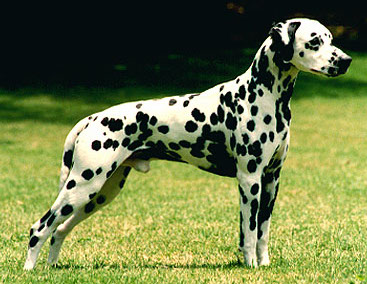 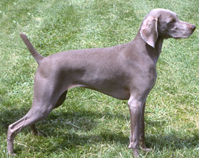 |
15/15 |
Exp2 |
beef cattle & milk cattle |
2 |
.jpg) 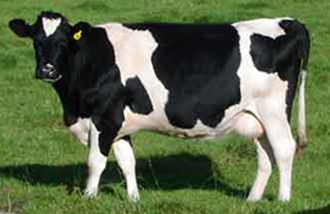 |
15/15 |
Exp3 |
butterflies, dragonflies & bugs |
3 |
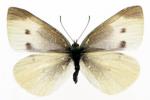 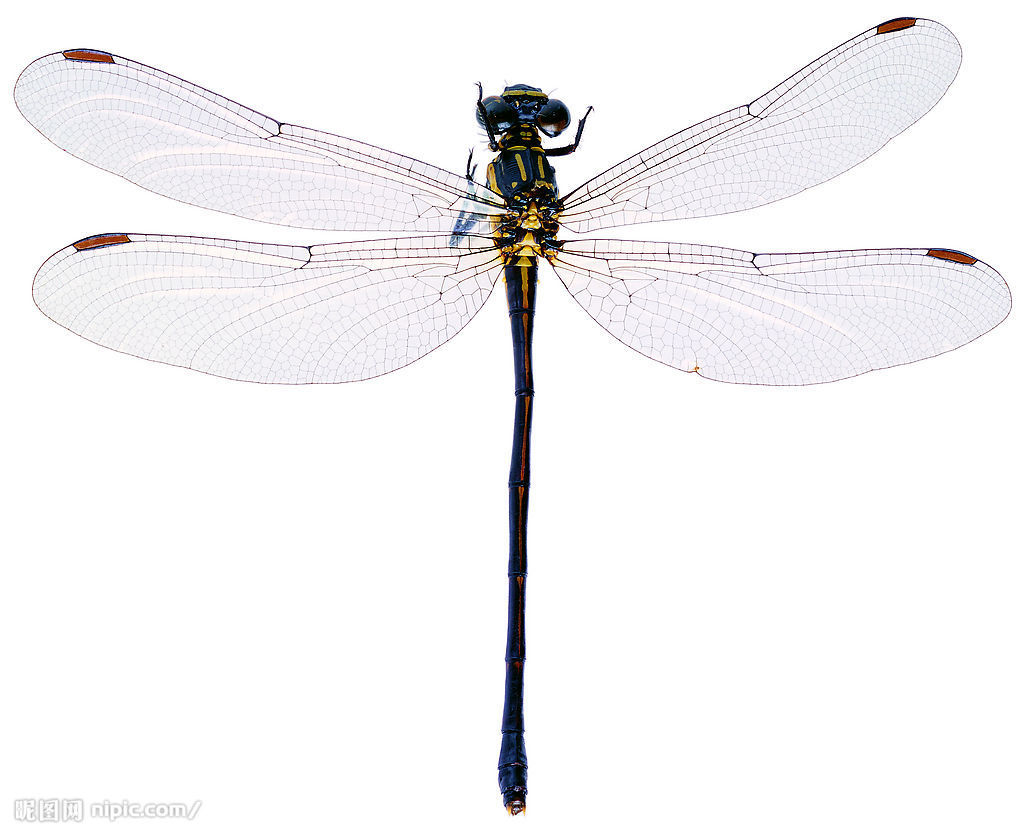 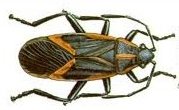 |
15/15/15 |
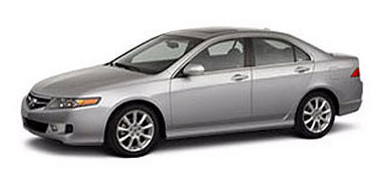
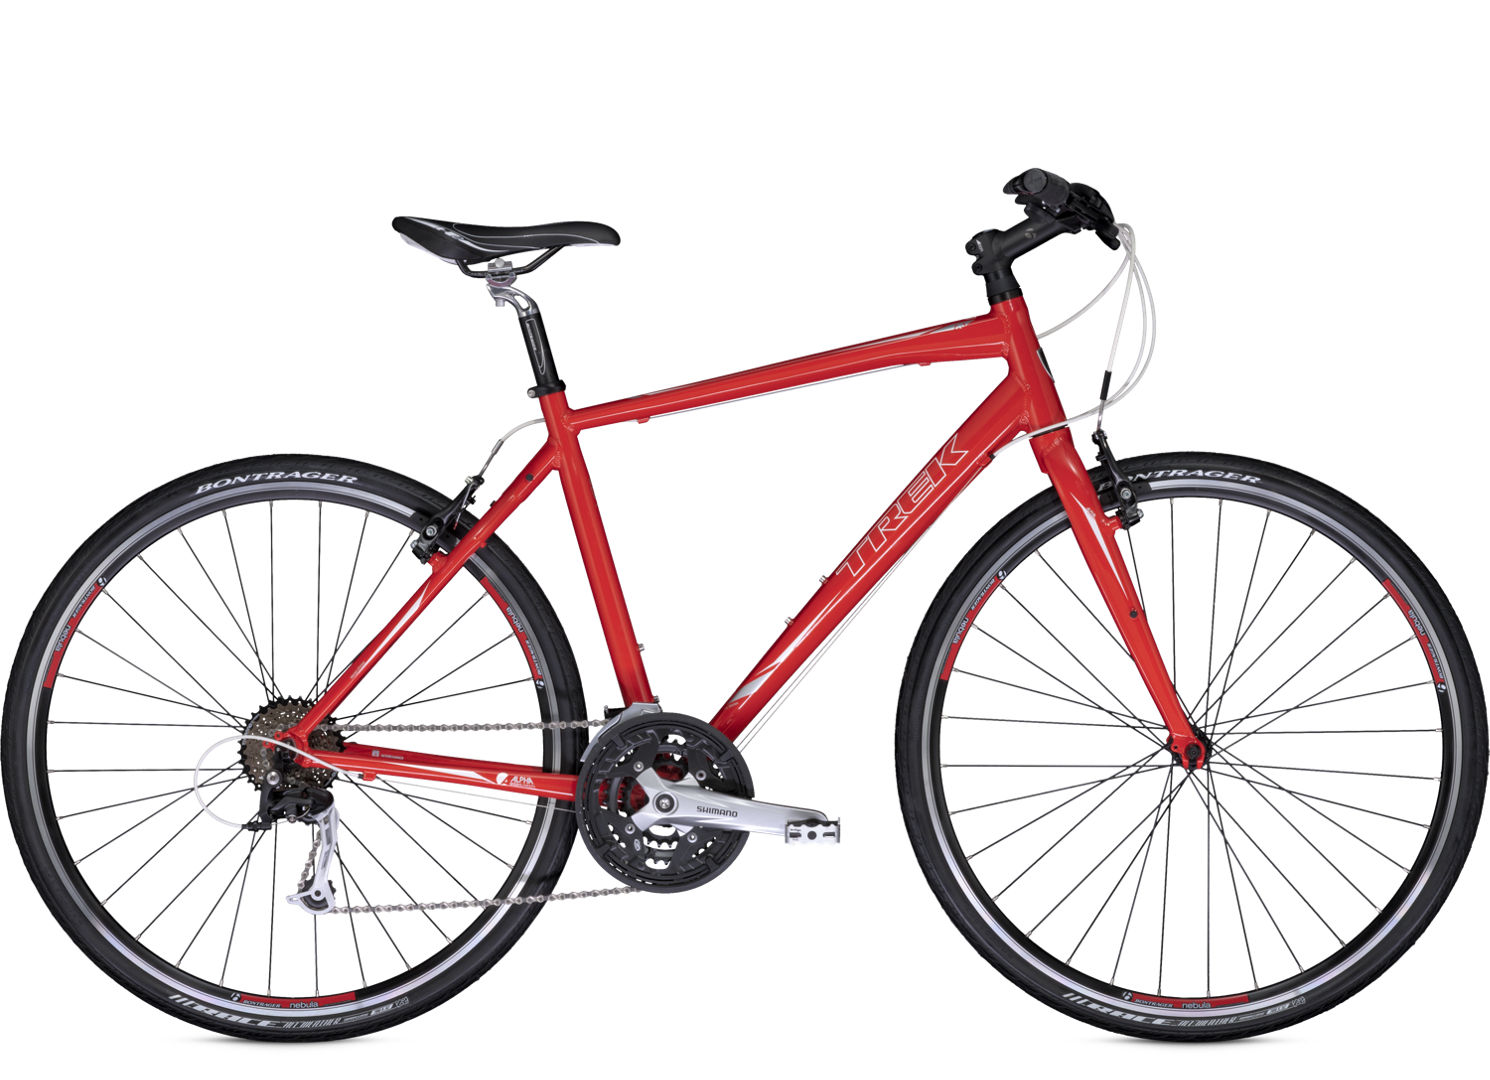
Exp4 |
Cars, motorbikes, scooters & bikes
|
4 |
    |
15/15/15/15 |
Exp5 |
Human faces, butterflies, & horses
|
3 |
   |
30/30/30 |
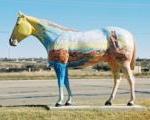
Exp6 |
Horses, pigeons, eagles, swans, & fishes |
5 |
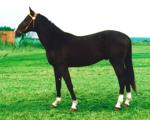 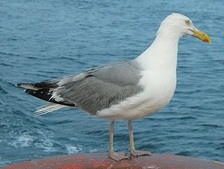 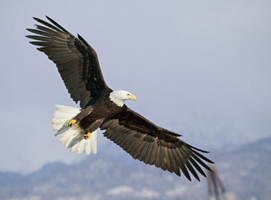 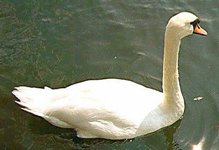 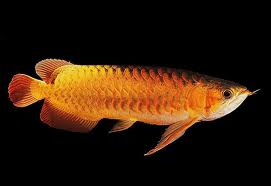 |
15/15/15/15/15 |
Exp7 |
Cats, deers, & wolves |
3 |
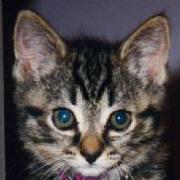  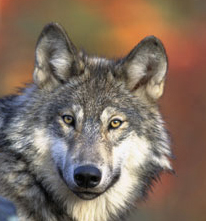 |
15/15/15 |
Trial |
Exp1 |
Exp2 |
Exp3 |
Exp4 |
Exp5 |
Exp6 |
Exp7 |
|||||||
purity |
entropy |
purity |
entropy |
purity |
entropy |
purity |
entropy |
purity |
entropy |
purity |
entropy |
purity |
entropy |
|
1 (seed=1) |
1 |
0 |
1 |
0 |
1 |
0 |
0.7500 |
0.3466 |
1 |
0 |
1 |
0 |
0.6667 |
0.6133 |
2 (seed=2) |
0.9333 |
0.2053 |
0.9667 |
0.1247 |
1 |
0 |
0.7500 |
0.3466 |
1 |
0 |
1 |
0 |
0.9333 |
0.2140 |
3 (seed=3) |
1 |
0 |
1 |
0 |
0.6889 |
0.4579 |
0.7500 |
0.3466 |
1 |
0 |
1 |
0 |
0.7333 |
0.5607 |
4 (seed=4) |
1 |
0 |
0.9667 |
0.1247 |
1 |
0 |
0.9833 |
0.0623 |
1 |
0 |
1 |
0 |
0.7778 |
0.4059 |
5 (seed=5) |
0.9000 |
0.2703 |
1 |
0 |
1 |
0 |
1 |
0 |
1 |
0 |
1 |
0 |
0.7333 |
0.5018 |
6 (seed=6) |
0.8667 |
0.3259 |
1 |
0 |
1 |
0 |
1 |
0 |
1 |
0 |
0.6000 |
0.5874 |
0.6889 |
0.4579 |
7 (seed=7) |
0.8667 |
0.3259 |
1 |
0 |
1 |
0 |
1 |
0 |
1 |
0 |
0.8000 |
0.2773 |
0.7333 |
0.5156 |
8 (seed=8) |
1 |
0 |
0.9667 |
0.1247 |
1 |
0 |
1 |
0 |
1 |
0 |
0.8000 |
0.2773 |
0.9111 |
0.2618 |
9 (seed=9) |
1 |
0 |
1 |
0 |
0.6889 |
0.4463 |
1 |
0 |
1 |
0 |
0.7867 |
0.3654 |
0.6667 |
0.5333 |
10 (seed=10) |
0.8667 |
0.3259 |
1 |
0 |
1 |
0 |
0.7167 |
0.4433 |
1 |
0 |
0.8000 |
0.2773 |
0.5663 |
0.9048 |
Trial |
Exp1 |
Exp2 |
Exp3 |
Exp4 |
Exp5 |
Exp6 |
Exp7 |
|||||||
purity |
entropy |
purity |
entropy |
purity |
entropy |
purity |
entropy |
purity |
entropy |
purity |
entropy |
purity |
entropy |
|
1 (seed=1) |
0.6333 |
0.6461 |
0.9333 |
0.2449 |
1 |
0 |
0.7500 |
0.3466 |
0.9333 |
0.2103 |
0.8000 |
0.3399 |
0.5333 |
0.8075 |
2 (seed=2) |
0.6000 |
0.6645 |
0.8333 |
0.4488 |
1 |
0 |
0.7500 |
0.3466 |
0.9333 |
0.2103 |
0.7867 |
0.3387 |
0.6444 |
0.6477 |
3 (seed=3) |
0.6333 |
0.6461 |
0.8333 |
0.4488 |
1 |
0 |
0.7500 |
0.3466 |
0.9444 |
0.1873 |
0.9733 |
0.0821 |
0.8667 |
0.3700 |
4 (seed=4) |
0.6000 |
0.6645 |
0.8333 |
0.4488 |
1 |
0 |
0.7500 |
0.3466 |
0.9333 |
0.2103 |
0.8267 |
0.3481 |
0.6889 |
0.6334 |
5 (seed=5) |
0.6333 |
0.6461 |
0.8667 |
0.3816 |
1 |
0 |
0.7500 |
0.3466 |
0.9444 |
0.1873 |
0.9733 |
0.0821 |
0.6444 |
0.6640 |
6 (seed=6) |
0.6333 |
0.6461 |
0.8333 |
0.4488 |
1 |
0 |
1 |
0 |
0.6667 |
0.4621 |
0.9733 |
0.0821 |
0.6222 |
0.7385 |
7 (seed=7) |
0.6333 |
0.6461 |
0.9000 |
0.3210 |
1 |
0 |
0.7500 |
0.3466 |
0.9333 |
0.2103 |
0.8000 |
0.2773 |
0.8444 |
0.4137 |
8 (seed=8) |
0.6333 |
0.6461 |
0.9333 |
0.2449 |
1 |
0 |
1 |
0 |
0.9444 |
0.1873 |
0.9733 |
0.0821 |
0.7778 |
0.5125 |
9 (seed=9) |
0.6000 |
0.6645 |
0.9000 |
0.3210 |
0.6667 |
0.4621 |
1 |
0 |
0.9333 |
0.2103 |
0.8000 |
0.2773 |
0.5778 |
0.8319 |
10 (seed=10) |
0.6333 |
0.6461 |
0.8333 |
0.4488 |
0.6667 |
0.4621 |
0.7500 |
0.3466 |
0.9444 |
0.1873 |
0.9733 |
0.0821 |
0.6667 |
0.7734 |
Exp1 |
Exp2 |
Exp3 |
Exp4 |
Exp5 |
Exp6 |
Exp7 |
|
| k-means with HOG | 0.623 ± 0.016 |
0.870 ± 0.043 |
0.933 ± 0.141 |
0.825 ± 0.121 |
0.911 ± 0.086 |
0.888 ± 0.091 |
0.687 ± 0.110 |
| EM with sparse FRAME | 0.943 ± 0.063 |
0.990 ± 0.016 |
0.938 ± 0.131 |
0.895 ± 0.132 |
1.000 ± 0.000 |
0.879 ± 0.141 |
0.741 ± 0.111 |
Exp1 |
Exp2 |
Exp3 |
Exp4 |
Exp5 |
Exp6 |
Exp7 |
|
| k-means with HOG | 0.652 ± 0.009 |
0.376 ± 0.086 |
0.092 ± 0.195 |
0.243 ± 0.167 |
0.226 ± 0.084 |
0.199 ± 0.126 |
0.639 ± 0.161 |
| EM with sparse FRAME | 0.145 ± 0.157 |
0.037 ± 0.060 |
0.090 ± 0.191 |
0.155 ± 0.189 |
0.000 ± 0.000 |
0.179 ± 0.208 |
0.497 ± 0.192 |