NAME:
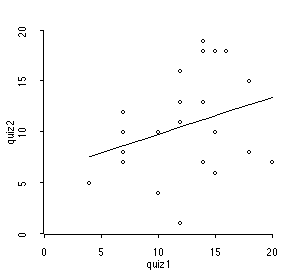
Does success on one quiz predict success on the next? Below is ARC output to determine if scores on the first quiz in this class could be used to predict scores on the second quiz. What do you think? Explain. A t-table is given on the third page. (That's a hint.)
Normal Regression
Kernel mean function = Identity
Response = quiz2
Terms = (quiz1)
Coefficient Estimates
Label Estimate Std. Error t-value
Constant 6.20330 3.39105 1.829
quiz1 0.364569 0.259700 1.404
R Squared: 0.0896955
Sigma hat: 4.95013
Number of cases: 22
Degrees of freedom: 20
MORE ON NEXT PAGE
Summary Analysis of Variance Table
Source df SS MS F p-value
Regression 1 48.2888 48.2888 1.97 0.1757
Residual 20 490.075 24.5037
Lack of fit 7 140.658 20.094 0.75 0.6382
Pure Error 13 349.417 26.8782
Assuming that the relation between the two variables is linear, than the slope tells us how y responds to x. But if the slope is zero, than knowing the score on quiz 1 tells us nothing about what will happen on quiz 2.
The hypothesis test for this is
H0: Beta1 = 0
HA: Beta1 <> 0
The test used is the t-test with n-2 = 20 degrees of freedom. The value of the test statistic for these data is 1.404. The critical value for alpha = 5% is 2.086. 1.404 < 2.086, so we do not reject and conclude that there is NO relation between the two quiz scores.
Note that we have no information to help us assess whether our assumptions (about linearity, independence, normality, constant variance) are true. However, the R^2 of 8.9 % suggests that, even if they were, this linear model would have very low predictive capabilities, since it explains only 8.9% of the variation in Quiz 2 scores.
Many people did a hypothesis test not
on the slope but on the intercept (Beta0 -- caled "constant" in the output
from ARC.) Note that this is not very useful. The interpretation
of the intercept is that its the estimate of the mean value on quiz 2 of
everyone who scored 0 on quiz 1. While this might be of some interest,
it's of no more interest than, say, the mean value on quiz 2 of everyone
who scored 5. Failing to reject the null hypothesis in this case
just means that those who scored 0 on quiz 1 might have also scored 0 on
quiz 2 (if the model fits.) It is the slope that relates the two
variables.