Correlation
Examples:
Is there a relationship between math anxiety and performance in a statistics class?
Is there a relationship between numerical skills and musical skills?
Is there a relationship between dosage and survival rate?
Is there a relationship between the degree of trauma experienced as a child and psychological problems experienced as an adult?
Is there a relationship between years of education and income?
Ask yourself -- can you think of questions in your major field/area of interest that are "relationship" questions?
When you want to study relationship or correlation between two variables, you need to measure every individual/thing/animal in the study with respect to both variables. This is bivariate (i.e. two -variable) analysis.
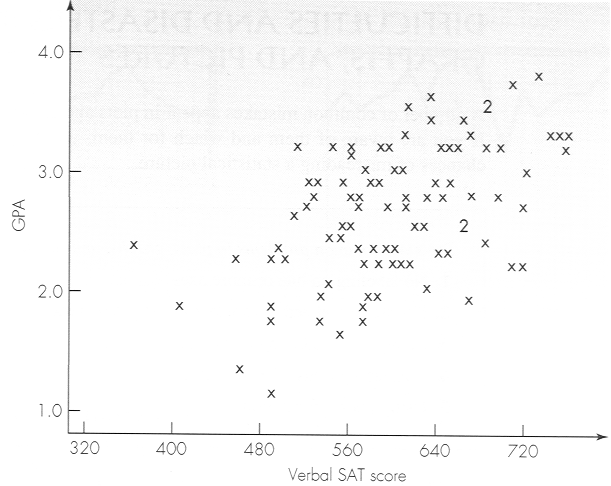
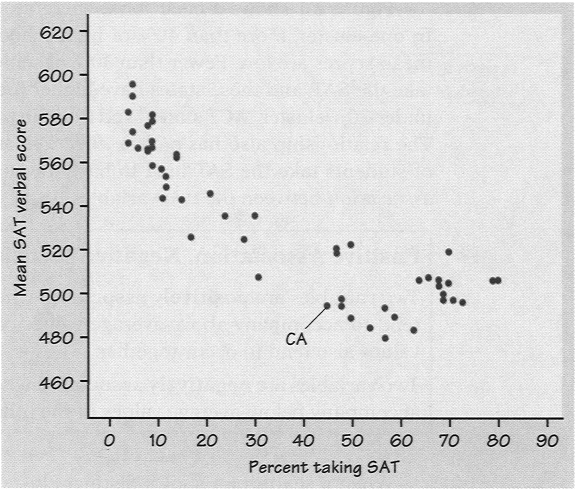
Scatterplot Example
A "positive relationship"

 A "negative" relationship
Interpretations:
Correlation Coefficient (formula on pages 132-134, but see note on p. 134 just before the review exercises) it's symbol is r. A formula:
å
[(each x- average of the x's) * (each y - average of the y's)]
r=    ---------------------------------------------------------
   (Standard Deviation x)  * (Standard Deviation y)