Review
Materials for Midterm 1
Exam coverage: Chapter 1, Chapter 2, Chapter 3.1-3.5,
Chapter 4 (but not 4.4), Chapter 5
Suggested Extra Problems From Your Textbook:
Chapter 3:
Exercise Set A #3, #4, #7
Exercise Set D #2
Review Exercises #1 and #4
Chapter 4:
Exercise Set A: #9
Exercise Set B: #1 - #5
Exercise Set E: #1, #4
Read the technical note on page 74 and Using a
Statistical Calculator (if it applies to you)
Chapter 5:
Exercise Set A #1
Exercise Set B #3, #4
Exercise Set C #1
Exercise Set E # 1 and #2
Exercise Set F #1
Page 428. #1, #3 (a & b), #5
Page 568. #4, #6
Relevant Concepts & Statistics
Treatment, Treatment Group, Control Group
Response
Confounding, Confounder
Randomization, Randomized Controlled Experiment
Blind, Double-Blind, Placebo
Observational Study
Association
Causation
Histogram, class interval
Variable
Average (mean), Standard Deviation, Median, Minimum, Maximum, Range, 25th Percentile, Median, 75th Percentile, Inter-Quartile Range
Standard Normal Distribution
Z scores or Standard Units
Percentiles and Transforming data or scores
I've
asked you to help me select a gift for my financial advisor, I'll call him
Oracle. You know nothing about cigars
(I hope) and have some information below from the pages of Cigar Aficionado, a magazine for cigar lovers which provides
ratings of various cigars. Cigars are
rated from a scale of 0 (horrible) to 5 (the best) by a panel of cigar
experts.
|
Cigar |
Rater
1 |
Rater
2 |
Rater
3 |
Rater4 |
Rater
5 |
Rater
6 |
|
Hinds |
3.9 |
3.6 |
3.5 |
3.5 |
3.6 |
3.3 |
|
AZ |
4.8 |
2.5 |
3.9 |
3.4 |
3.1 |
3.7 |
Both
cigars cost exactly the same amount per cigar and both are coronas (his
favorite) so cost and type of cigar are not issues here. What is at issue is pleasing Oracle by
giving him a cigar that he will probably enjoy.
1. Please calculate the mean, standard
deviation, median, and interquartile range of the ratings for each of the
cigars. (MAKE SURE YOU FILL OUT THE ANSWER SHEET IN BACK)
(SHOWING
WORK IS NOT REQUIRED FOR THIS QUESTION)
|
|
Hinds |
AZ |
|
Mean
(1 pt each) |
|
|
|
Standard (2 pts each) Deviation |
|
|
|
Median
(1 pt each) |
|
|
|
Interquartile (2 pts each) Range |
|
|
2. Based on what you have learned about
statistics so far, which cigar (I will only buy one) will you advise me to buy
for Oracle ? Please explain your choice in terms of the statistics you calculated
in the previous problem and from the original Cigar Aficionado ratings if necessary to help your argument. (8 points)
Please answer some questions about this graphic. It was drawn to represent the distribution of returns for a database of mutual funds:
.
![]()
![]()
![]()
![]() 3
3
![]() 2.5
2.5
![]()
![]()
![]()
![]()
![]()
![]() 2
2
1.5
![]()
![]()
![]()
![]()
![]()
![]() 1
1
![]() 0.5
0.5
![]() 0
0
10 20 30 40 50 60 70 80 90 100
(percentage return)
3.
Using
information from the graphic, what is the median percentage return? (5 points)
A. 50%
B.
52.5%
C.
55%
D.
This
"histogram" has been incorrectly drawn. The median cannot be determined.
E.
This
"histogram" has been correctly drawn, but the median cannot be
determined from a graphic.
4.
What
is the inter-quartile range (IQR) of this distribution of mutual fund percentage
returns? (5 points)
A. 45%
B.
50%
C.
55%
D.
This
"histogram" has been incorrectly drawn. The IQR cannot be determined.
E. This
"histogram" has been correctly drawn, but the IQR cannot be
determined from a
graphic.
5.
(5 points) A sociologist conducted a study on the effects of two teaching
styles. One style was Authoritarian (A) with strict discipline and many rules.
The other style was more Democratic (D) where students were given fewer
restrictions and encouraged to set their own standards of conduct. Comparing
standardized tests scores before and after the teaching techniques were
introduced, she found the following:
ALL
STUDENTS
|
STYLE |
Number
Improved |
Number
Unimproved |
Total |
%
Improved |
|
D |
252 |
148 |
400 |
63% |
|
A |
210 |
190 |
400 |
53% |
When
she disaggregated the data into class in school, that is: Freshmen and
Sophomores versus Juniors and Seniors she was surprised to see the following:
FRESHMEN
AND SOPHOMORES
|
TEACHING STYLE |
Number
Improved |
Number
Unimproved |
Total |
%
Improved |
|
D |
210 |
90 |
300 |
70% |
|
A |
75 |
25 |
100 |
75% |
JUNIORS
AND SENIORS
|
TEACHING STYLE |
Number
Improved |
Number
Unimproved |
Total |
%
Improved |
|
D |
42 |
58 |
100 |
42% |
|
A |
135 |
165 |
300 |
45% |
Which
is the confounding variable?
A. Teaching Style
B. Class in School
C. Percentage Improved (far right column)
D. None of the above, there is no
confounding in these tables
Al
and Larry are mutual fund managers.
Al's fund FEDCHAIR has a one-year return of
-4%
(a loss). Larry's fund TREASECT has a
one-year return of 8% (a gain). The 6,000 mutual funds reported by the Wall
Street Journal are normally distributed with a mean one-year return of -1% and
a standard deviation of 12%
6. What percentage of mutual funds had
returns between Al's & Larry's funds?(5 points)
A. About
20%
B. About
35%
C. About
37%
D. About
55%
E. About
74%
7. Another manager's, Stuart, fund is in
the bottom 5% (i.e. about 5% of the funds have returns lower than his) of all
mutual funds, what was his one-year return? (5 points)
A. About
-23%
B. About
-22%
C. About
-20%
D. About
-18%
E. About
-2%
8. In order to meet my retirement goals, I
need to buy into a mutual fund that has a return of 14% or more. Approximately how many funds can I pick
from? (5 points)
A. Less
than 650 funds
B. About
815 funds
C. About
840 funds
D. About
880 funds
E. About
1,270 funds
9. Oracle, my financial adviser, believes
inflation should be taken into account when measuring fund performance. Suppose Oracle adjusts all of the fund
returns by subtracting 4% and then multiplying by 2. For example, Al's fund
would now return -16% (a loss) according to Oracle. I need a return of 8% or more now. What percentage of funds
qualify? (5 points)
A. Less
than 10%
B. Around
25%
C. More
than 50%
D. Oracle's
formula contains an error, percentage cannot be calculated
E.
Oracle's formula does not contain an
error, but there is not enough
information available to
calculate a percentage.
10.
This graphic appeared in The Daily Bruin
last week. These are some results from
a national survey of college freshmen.
Approximately 364,546 freshmen responded and it was statistically
adjusted to be representative of the 1.6 million freshmen entering college in
the fall of 1999 as first-time, full-time students. Many questions are asked of the freshmen such as career goals,
general levels of satisfaction, drug use, and activity levels. The article went on to note that stress
levels were the highest in 30 years as was the level of those interested in
teaching as a career.
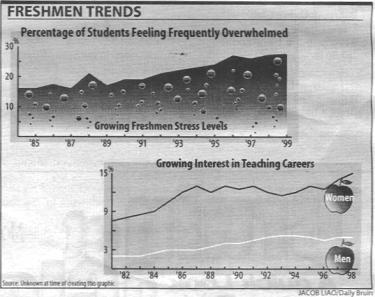
An
unnamed politician reviewed this study and concluded "high stress is good
for students because it encourages them to go into teaching as a career and
this country needs more teachers."
In
light of what you have learned so far in Statistics 10 please comment on the
politician's analysis of the survey results.
Do you think his conclusions are reasonable? If yes, please explain why, if not, please tell us why not. (5
points)