Textbook Example 4
More On Confidence Intervals

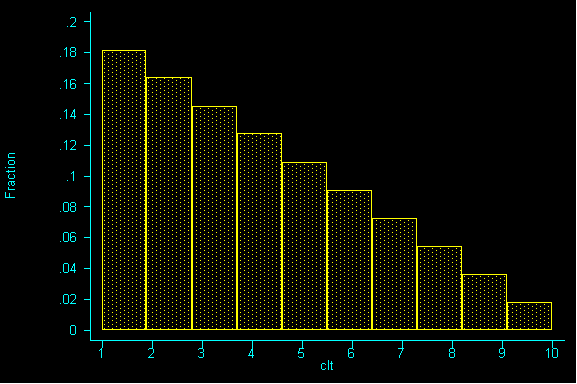
Last time, we examined a population with the following parameters:
mean=4, standard deviation=2.472
And you can see very clearly that it's not normally distributed. The suggestion made in the last assignment was this: in real life, we generally don't know what the population looks like (that is, is it normal?), but frequently we are interested in finding the population mean (or average). We don't have enough money or time to ask everyone, so we sample. As a result, we must use a sample mean to tell us "something" about the population mean.
Suppose I had shown you the population above, but not given you the parameters and then asked "what is the population mean"?
One way to answer these questions is by reporting a 95% confidence interval. A 95% confidence interval is an interval generated by a random process that's right 95% of the time. Similarly, A 68% confidence interval is an interval generated by a random process that's right 68% of the time and a 99% confidence interval is an interval generated by a random process that's right 99% of the time. If we were to replicate our study many times, each time reporting a 95% confidence interval, then 95% of the intervals would contain the population mean difference. In practice, we perform our study only once. We have no way of knowing whether our particular interval is correct, but we behave as though it is.
In theory, we can construct intervals of any level of confidence from 0 to 100%. There is a tradeoff between the amount of confidence we have in an interval and its length. A 95% confidence interval for a population mean is constructed by taking the sample mean and adding and subtracting approximately 2, (1.96 to be exact) standard errors of the mean. A 68% CI adds and subtracts 1 SEMs (standard errors of the mean), while a 99% CI adds and subtracts about 3 (2.57 to be exact) SEMs.
The shorter (narrower) the confidence interval, the less likely it is to contain the population mean. The longer (wider) the interval, the more likely to contain the quantity being estimated. Ninety-five percent has been found to be a convenient level for conducting scientific research, so it is used almost universally. Intervals of lesser confidence would lead to too many bad intervals. Greater confidence would require larger samples to generate intervals of meaningful lengths.
So let's look at some examples:
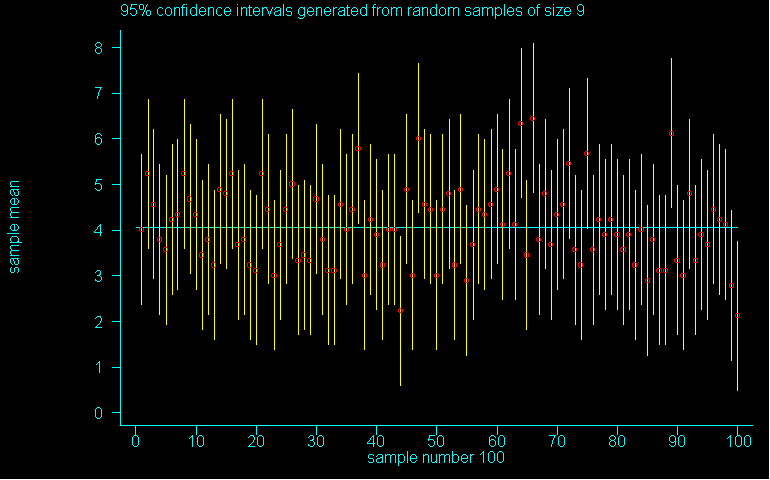
Here is a graph of 100 different 95% confidence intervals constructed from 100 different samples of size 9. It's a small sample,yes, but let's see how well the theory works, even for small non-normal samples.
The ends of the lines are the high and low estimates for each sample mean (the mean is a red circle). The line running through the middle of the graph represents a mean of 4 (the parameter). If you want to see this animated, just click on the picture.
Question 1: How many confidence intervals failed to "touch" the parameter?
Question 2: How many confidence intervals did you EXPECT to fail?
Question 3: Can you identify 2 reasons why you might get a number from question 1 that is different from question 2?
Here is a graph of 100 99% confidence intervals constructed from the same 100 samples of size 9 as used in the previous example. Click on it to animate it.
Question 4: As we move from 95% to 99% confidence, what happens to the intervals? Specifically -- what happened to the endpoints and how many touched or failed to touch the parameter?
Here is a graph of 100 68% confidence intervals constructed from the same 100 samples of size 9 as used in the previous example. Click on it to animate it.
Question 5: As we move from 95% to 68% confidence, can you tell me what is happening here and why a researcher or a journalist would want to avoid 68% confidence?
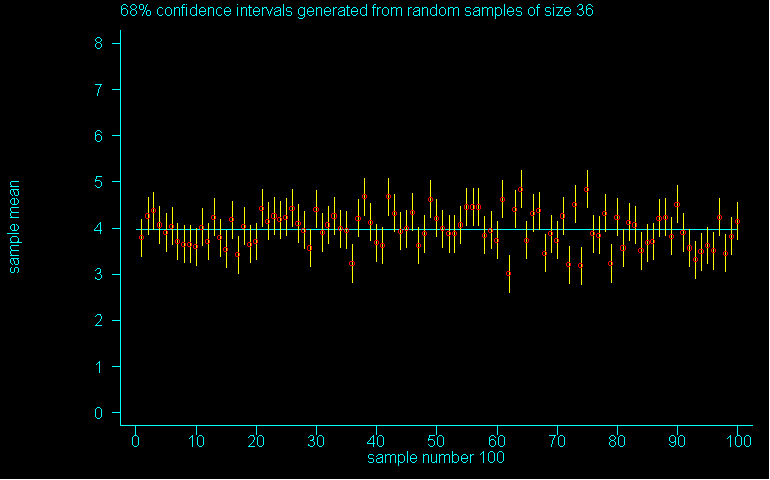
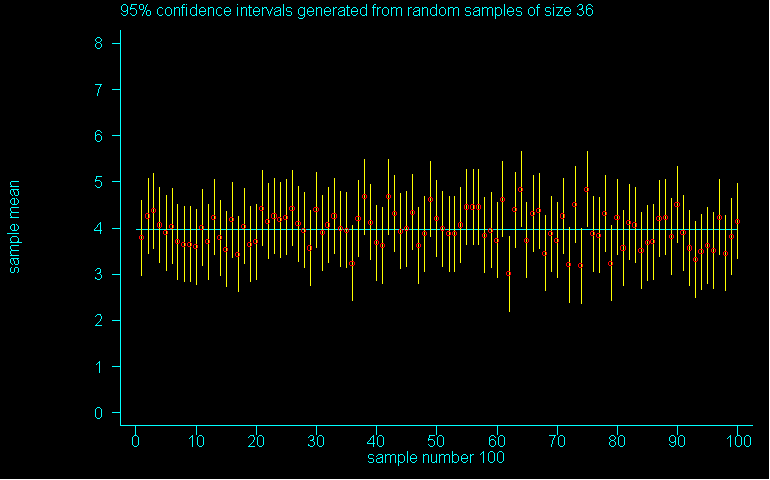
Let's example the effect of sample size on confidence below are graphs of 100 68%, 95% and 99% confidence intervals for samples of size 36. So they are still "small" (but over size 30) and 4 times larger than the samples of size 9 used earlier.


Question 6: Compare these to each other and then to the corresponding level of confidence for the samples of size 9. Then answer the last question (a general answer will do): (a) for a given level of confidence, what happens to the width of the interval as the sample size increases? (b) for a given level of confidence, what happens to the number of intervals that "touch" the parameter as the sample size increases? (c) can you give a reason for part (b)? What do you think is happening here?
THIS IS DUE FEB 26th AS PART OF HOMEWORK 5
