Economics 40/Statistics M11 Lab 5: Testing Hypotheses
Due Friday, March 12, 1999
Purpose: The purpose of this lab is to use Excel to test a hypothesis. There is no lab 4, everyone gets full credit for that lab.
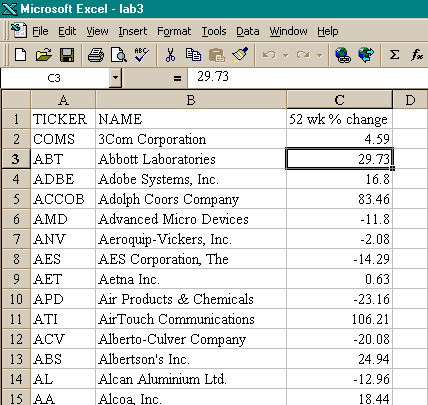
Data: We will use the same data on the S & P 500 that was used in lab 3. So if you saved your spreadsheet from the last lab, you are in luck. If you did not save it, remember the data is NOT on your CD, instead, you will need to download it from the web page for this class. Please do this part of the assignment as soon as you can just in case there are problems with accessing the data.
Get the data into an Excel Workbook. It should look like something like this:

ASSIGNMENT
A statement of no difference or no effect would look something like this:
H0: m = 11.0476 (this is the overall average, the population mean, for the S & P 500 stocks)
In other words, the null suggests that one could treat the stocks with ticker symbols which begin with "A" as a random sample. That is, there should be no relationship between 52 week percentage returns and ticker sign.
The alternative hypothesis is, as stated on p. 455 of your text "a name to the statement we hope is true instead of the null"
For this assignment:
Ha: m > 11.0476

Then calculate the average for the "A stocks". This will serve as your sample average. There are 52 stocks which have tickers beginning with the letter "A".
Perform your test by calculating Z. What did you get for Z, what is the P-value associated with Z and how would you interpret that P-value (review pp. 456-457 in your text)? Is there evidence to support the theory of "A stocks"?

Remember to click on the option to copy the sheet. You should get a new sheet with the exact same data.
Now, delete America Online, recalculate the population parameters and re-do the test. What is your new result and what is your interpretation? Do you believe the theory still has merit?
SUMMARY
A complete assignment requires the following:
No printouts from Excel are necessary. We will check for correct values for the Zs, P-values and your interpretation of the P-values.