Experiment 3
Supervised learning and classification
(0) The testing stage can be greatly accelerated by ignoring the
inhibition step.
In experiment 3, we learn the template from positive training images. Then we use the learned template
to score the positive and negative testing images, and obtain the ROC curve. In both the training and
testing images, the bounding boxes are given.
Experiment 3 focuses on the situation where the number of positive
training images is
relatively small. Compared to adaboost, the
active basis model applies non-maximum
suppression instead of re-weighting before selecting the next basis element.
The active basis model does not require negative examples (except pooling a marginal
histogram from natural images). Moreover, the generative model can be conveniently
used for unsupervised learning as we shall show in the following sections.
(1) data, codes, and readme for classification comparison
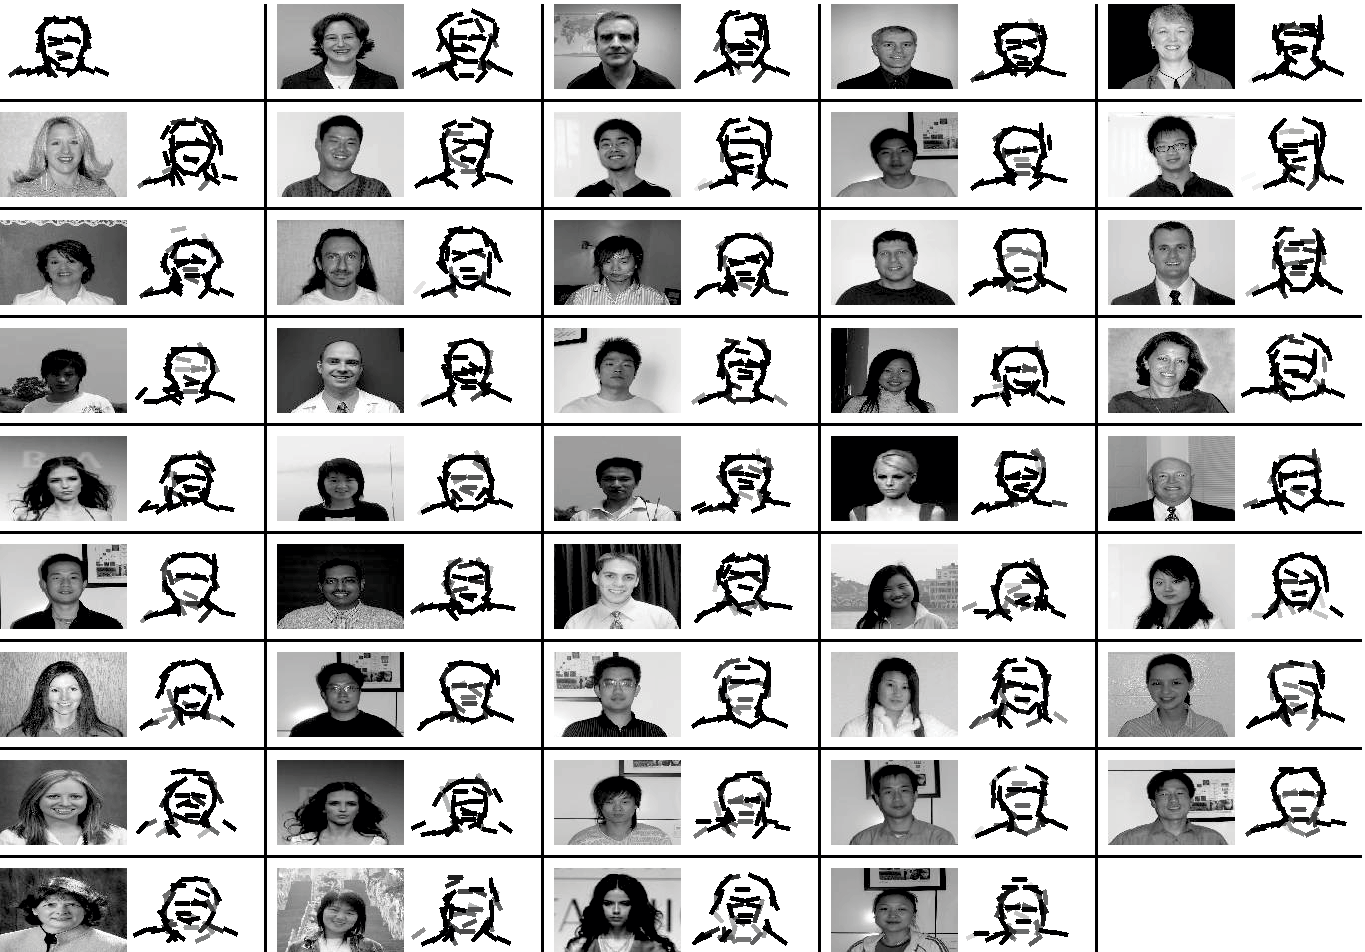
Experiment 3.1. Results obtained by fitting the active
basis model with sigmoid transformation.
The saturation level is 6. The 43 images are 127*85. The number of basis elements
40.
eps
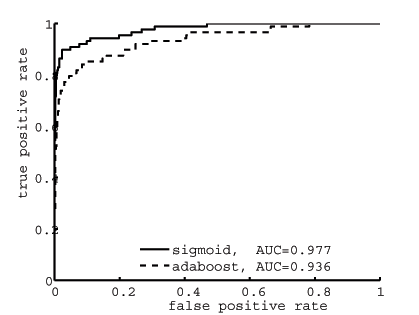
Experiment 3.1. The solid curve is ROC of active basis
model with sigmoid transformation.
The dashed curve is ROC of the
adaboost method where the weak classifiers are based on
thresholding
the filter responses in SUM1 maps.
eps


Experiment 3.1. Left: The template learned by the active
basis model.
Middle: Learned by the adaboost method.
Right: Learned from
tiny training images.
eps1
2
3
ROC report: threshold = .941, thresholdCORR = .971, whiten = .965, whitenCORR = .974,
sigmoid6 = .977, bi-basis = .982, adaptive = .983, tiny = .957, single = .926; adaboost on SUM1 = .936,
adaboost on MAX1 = .943.
(2) another example
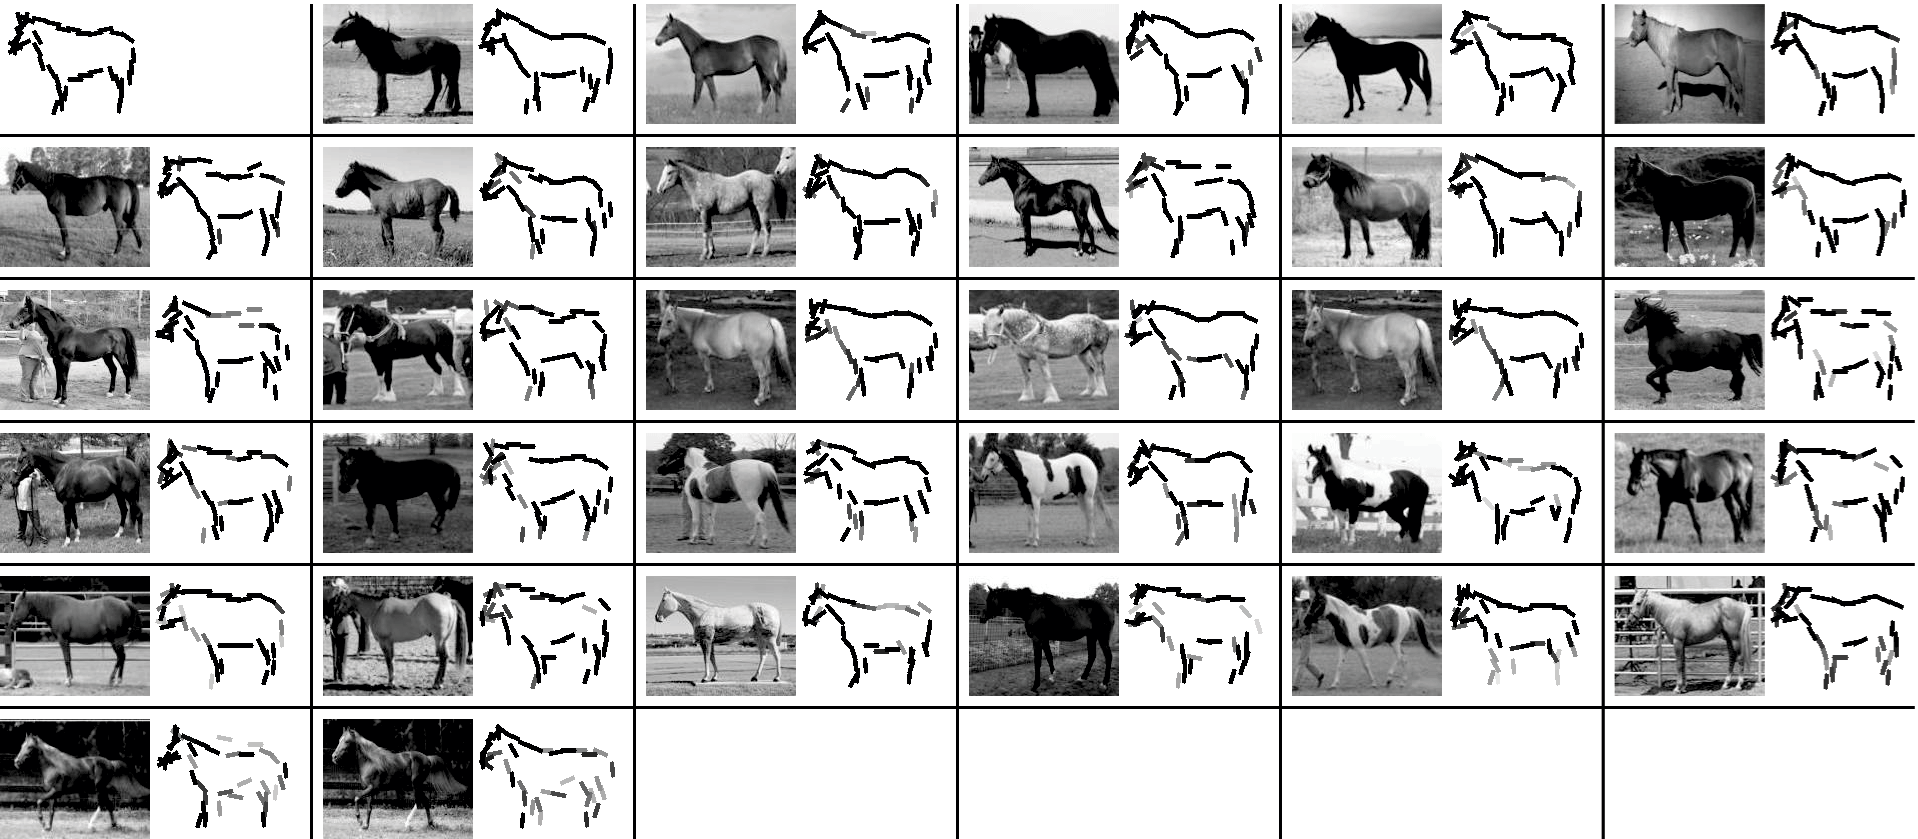
Experiment 3.2. The 31 images are 150*120. The
number of basis elements is 40.
eps
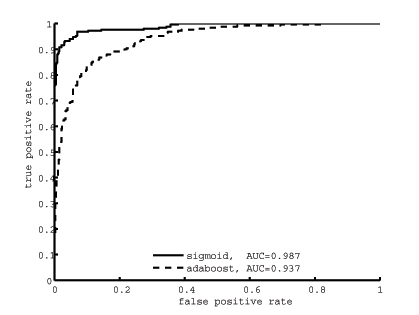
Experiment 3.2. Comparison between sigmoid and adaboost.
eps
ROC report: threshold = .981, thresholdCORR = .985, whiten = .982, whitenCORR = .984,
sigmoid6 = .987, bi-basis = .988, adaptive = .989, tiny = .956, single = .980; adaboost on SUM1 = .937,
adaboost on MAX1 = .957.
(3) a third example
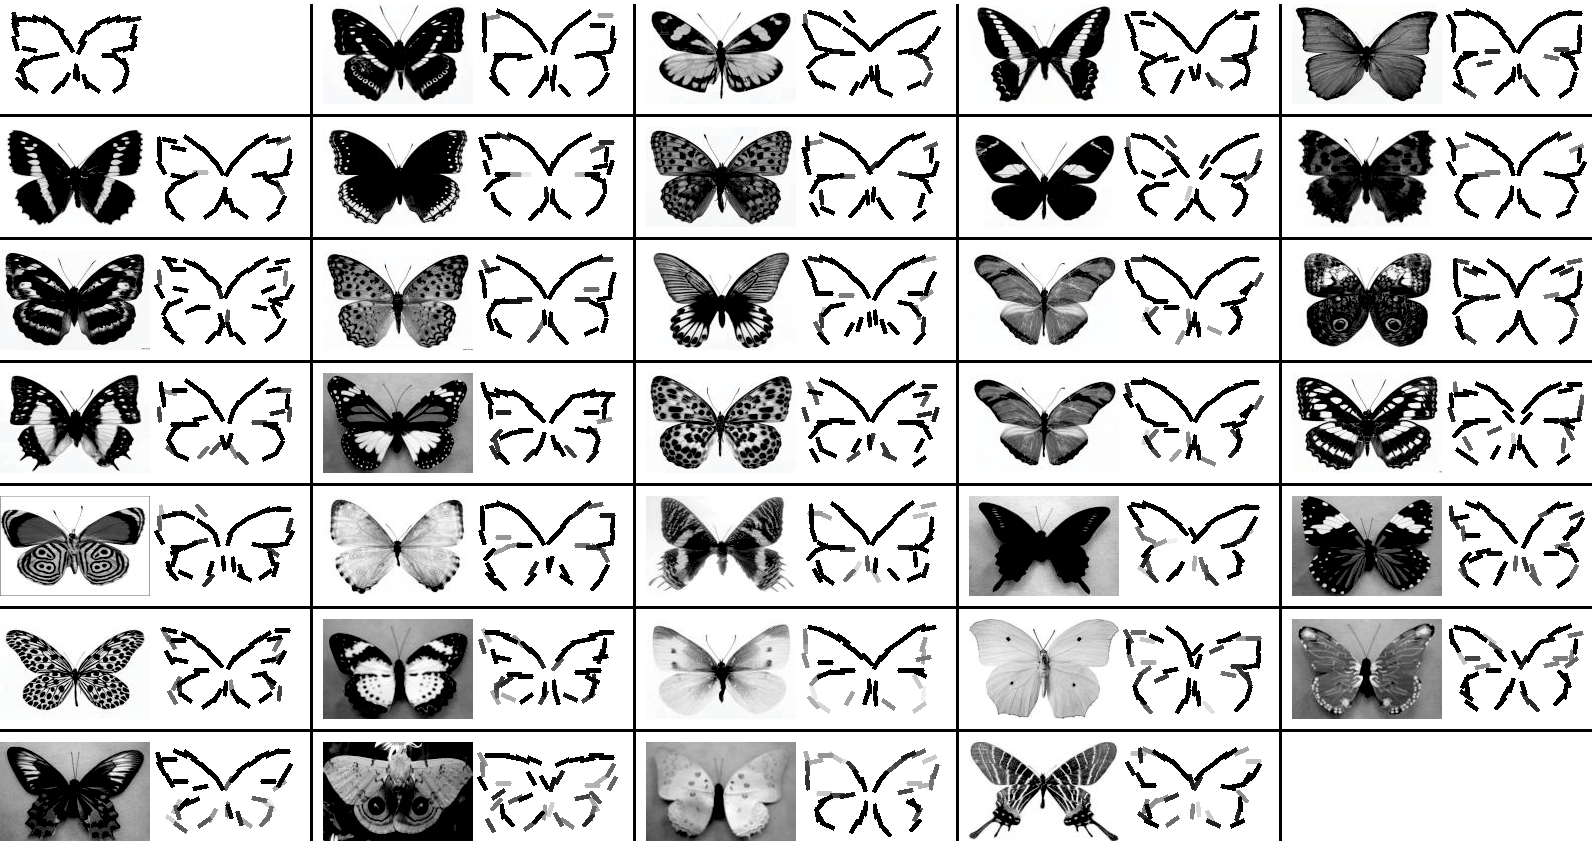
Experiment 3.3. The 33 images are 150*100. The
number of basis elements is 40.
eps
sigmoid = .999; adaboost on MAX1 = .994.
Back to active basis homepage


