How to draw a graph in TikZ
We will use a TikZ standalone document. This can then be included in a Beamer document. (TikZ and Beamer do no mesh well. It also saves compile time for slides.)
The following LaTeX code:
\documentclass[12pt]{standalone}
\usepackage{tikz}
\usetikzlibrary{calc}
\usepackage[cm]{sfmath}
\usetikzlibrary{arrows.meta}

\begin{document}
    \begin{tikzpicture}[
        x=1.3cm,
        y=1.3cm,
        cell/.style={circle},
        blue cell/.style={cell, fill=cyan!25!white},
        gen edge/.style={thick,->,-{Latex[width=2mm]}}]

        \node[blue cell] (Z) at (0,0.2) {$Z$};
        \node[blue cell] (A) at (-.8,-1) {$A$};
        \node[blue cell] (X) at (1,-1) {$X$};
        \node[blue cell] (V) at (1,0.2) {$V$};
        \draw[gen edge] (Z) edge (A);
        \draw[gen edge] (Z) edge (X);
        \draw[gen edge] (V) edge (X);
    \end{tikzpicture}
\end{document}
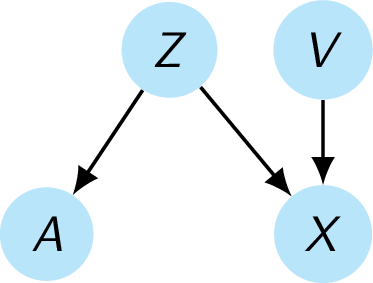
generates the following graph: